
Rena Orman, PhD
Research Associate Professor
Physiology and Pharmacology
My research is focused on neurophysiological and neuroanatomical evidence for regional and long-range neuronal circuits. Brain regions of particular interest include: claustrum, endopiriform nucleus, amygdala and limbic cortex (hippocampal formation, retrosplenial cortex). The main animal model for this work is Seba’s short-tailed fruit bat, Carollia perspicilata. We do like using, on occasion, naked mole rats among other animal models.
Our goal is to understand the intrinsic structure-function relationships in subcortical brain structures such as claustrum and amygdala and the roles these structures play as part of reciprocal circuits with cortical regions. In studies of these structures, we have been able to discover some unique features that had previously been underappreciated.
Examples:
We showed a baseline biochemical hemispheric asymmetry in amygdala that was enhanced in fear-conditioned responses to tone but reversed in left-right balance with conditioning to context.
We showed asymmetrical axonal arbors on CA1 pyramidal cells and demonstrated how this asymmetry impacted the local spread of activity within the region – favoring spread toward subiculum.
We showed a remarkable directional connectivity in the rat claustrum, one of the most poorly understood structures in brain, and have been developing an entirely new model, the fruit bat, for studies of claustrum.
Our main model organism is Carollia perspicilata, the short-tailed fruit bat. For electrophysiological studies, we employ multi-electrode array recordings in brain slice physiology, a range of immunohistochemical, biochemical, and other anatomical methods (e.g., brain vasculature reconstruction – in collaboration with Tissue Vision, Newton, MA).
Figures with representative data:
Figure 1
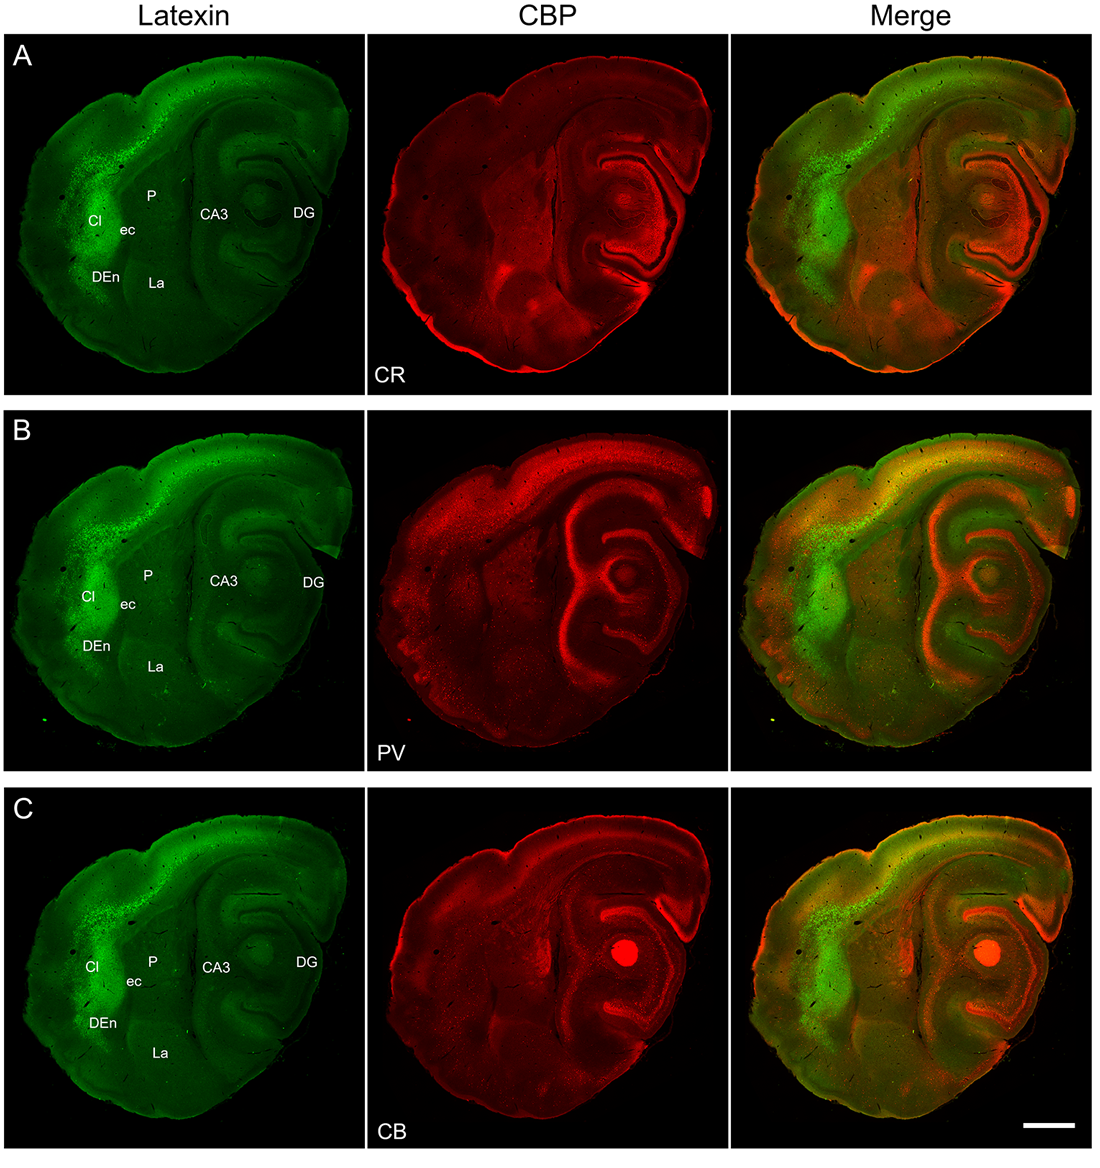
Figure 1. Latexin-labeling and immunoreactivity for three calcium-binding proteins (calretinin, parvalbumin, and calbindin) in the brain of Carollia perspicillata. Adjacent sagittal sections (A-C). Left, middle, and right columns display latexin, one of the three calcium-binding proteins (CBP), and the merged image, respectively. (A) Latexin and calretinin (CR) immunoreactivity (panels F from Figures 1 and S1). Latexin neurons and neuropil highlight claustrum and dorsal endopiriform nucleus. Latexin neurons are also seen in the dorsolateral cortex (as indicated in Figure 1). The calretinin-poor region in claustrum corresponds to the latexin-dense core. Calretinin immunoreactivity is also prominent in dentate gyrus, striatum, and amygdala. (B) Latexin and parvalbumin (PV) immunoreactivity (panels F from Figures S2 and S3). Parvalbumin is dense in the core of claustrum where latexin is most dense. Parvalbumin is sparse in the shell region and in dorsal endopiriform nucleus. Parvalbumin is dense in dorsolateral cortex, hippocampus, striatum, and amygdala. (C) Latexin and calbindin (CB) immunoreactivity (panels F from Figures S4 and S5). Calbindin-ir neurons are widely distributed across the section, including claustrum, dorsal endopiriform nucleus, overlying neocortex, and hippocampal regions. Anterior is to the left; posterior is to the right; dorsal is up; ventral is down. Abbreviations: CA3, area CA3 of hippocampus; Cl, claustrum; DG, dentate gyrus; DEn, dorsal endopiriform nucleus; La, lateral amygdala; P, putamen. Scale bar = 1 mm. From Morello et al. (2022).
Figure 2
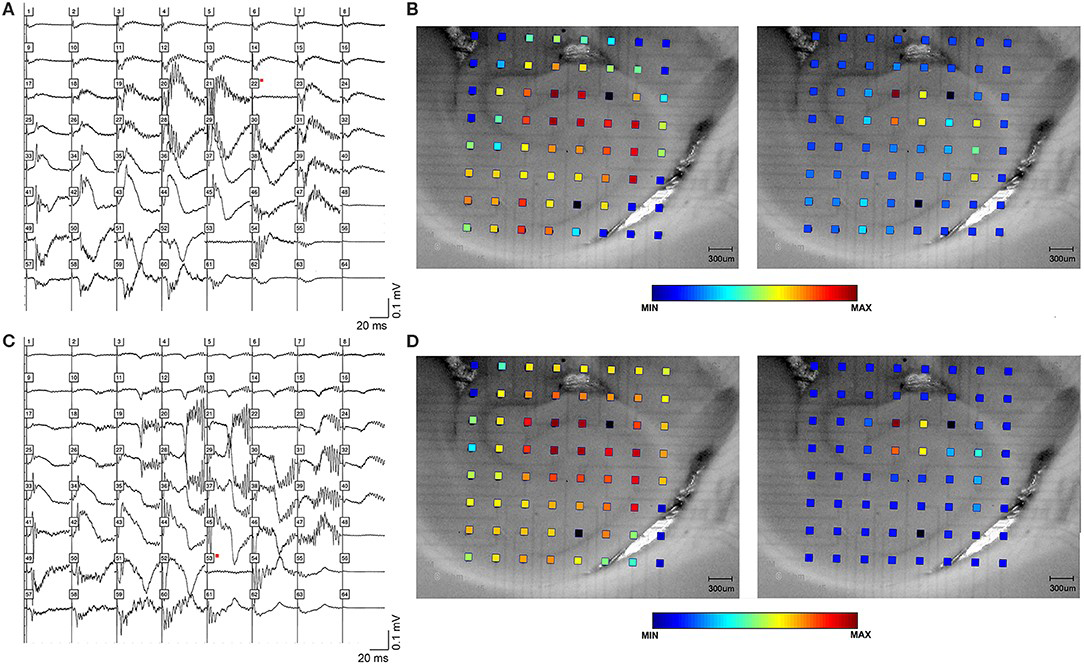
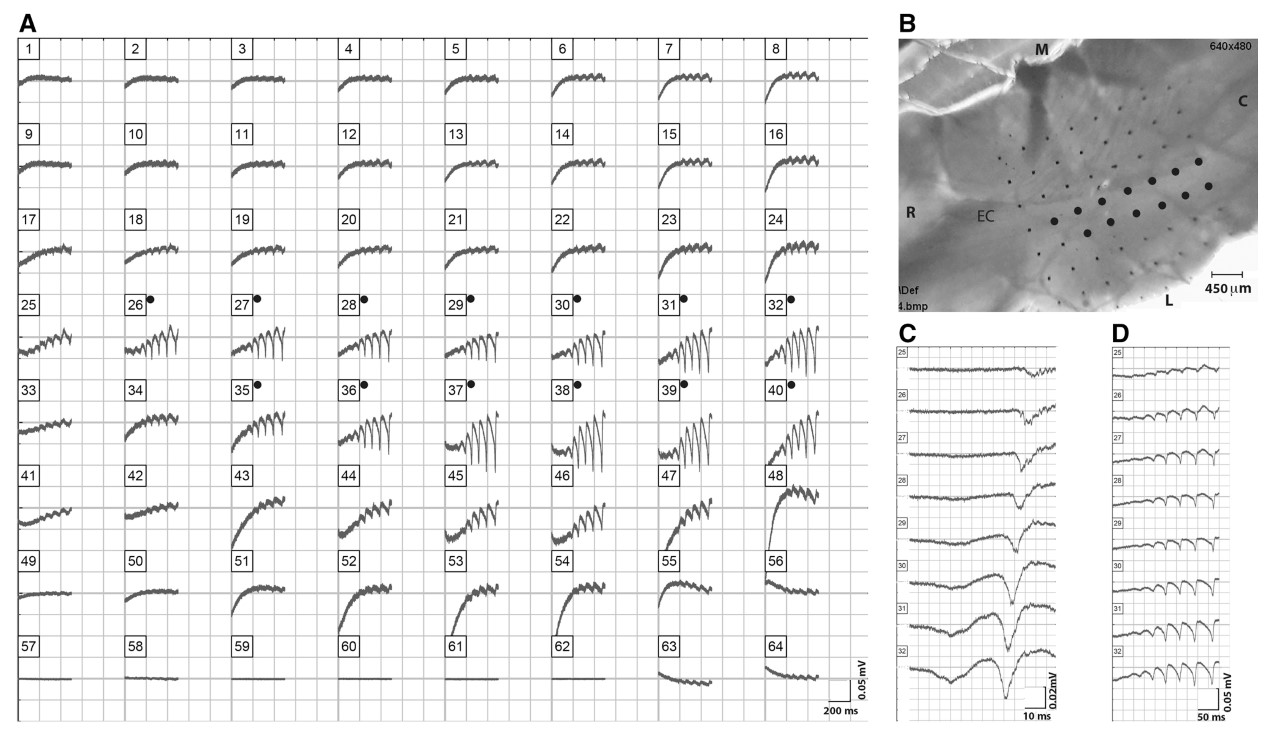
Figure 3
Personnel
Timothy Morello, M.D/.Ph.D. candidate (Ph.D. co-mentors: Richard Kollmar and Mark Stewart).
Frederick Okoye III – D.O .candidate and Lang Urology Research Fellow (co-mentored with Jeffrey Weiss, Richard Kollmar, and Mark Stewart).
- Morello, T., Kollmar, R., Ramzaoui, A., Stewart, M., and Orman, R. (2022). Differential distribution of inhibitory neuron types in subregions of claustrum and dorsal endopiriform nucleus of the short-tailed fruit bat. Brain Struct. Funct. 227, 1615-1640.
- Stewart, M., Morello, T., Kollmar, R., and Orman, R. (2021). Carollia perspicillata: A small bat with tremendous translational potential for Studies of brain aging and neurodegeneration. Biomedicine 9. 10.3390.
- Naggar, I., Stewart, M., and Orman, R. (2020). High frequency oscillations in rat hippocampal slices: origin, frequency characteristics, and Spread. Front. Neurol. 11, 326.
- Smith, J. B., Alloway, K. D., Hof, P. R., Orman, R., Reser, D. H., Watakabe, A., and Watson, G. D. R. (2019). The relationship between the claustrum and endopiriform nucleus: a perspective towards consensus on cross-species homology. J. Comp. Neurol. 527, 476-499.
- Orman, R., Kollmar, R., and Stewart, M. (2017). Claustrum of the short-tailed fruit bat, Carollia perspicillata: alignment of cellular orientation and functional connectivity. J. Comp. Neurol. 525, 1459-1474.
- Orman, R. (2015). Claustrum: a case for directional, excitatory, intrinsic connectivity in the rat. J. Physiol. Sci. 65, 533-544.
- Orman, R., Von Gizycki, H., Lytton, W. W., and Stewart, M. (2008). Local axon collaterals of area CA1 support spread of epileptiform discharges within CA1, but propagation is unidirectional. Hippocampus 18, 1021-1033.
- Orman, R., and Stewart, M. (2007). Hemispheric differences in protein kinase C betaII levels in the rat amygdala: baseline asymmetry and lateralized changes associated with cue and context in a classical fear conditioning paradigm. Neuroscience 144, 797-807.